Overview
This project explores 20 years of historical Premier League data alongside betting market odds. By analyzing patterns in match outcomes and bookmaker predictions, the aim was to determine whether data-driven insights could outperform traditional betting markets. Machine learning techniques were employed to build predictive models that estimate match probabilities, and interactive Tableau dashboards were used to showcase the findings in a visually engaging manner.
Objective
The main objective was to leverage machine learning to predict match results and uncover inefficiencies in betting markets. Specifically, I aimed to:
- Build accurate predictive models for win, draw, and loss probabilities.
- Compare these predictions to betting market odds to identify potential profitability.
Process
1. Data Gathering
The primary dataset was sourced from football-data.co.uk, which provided extensive match statistics over 20 seasons. The data included details such as match date, team names, full-time and half-time scores, full-time result, shots, shots on target, corner counts, fouls, yellow cards, and red cards. Additionally, the dataset contained betting odds from various bookmakers like Bet365, Betfair, Ladbrokes, and William Hill, as well as columns for average and maximum odds for each outcome.
To enhance the dataset, I incorporated end-of-season results to use as a variable for subsequent seasons. Furthermore, transfer-related data was sourced from transfermarkt.com, including player transfers, money spent and received by each team, and new player arrivals. This data allowed me to incorporate transfer window activity as a factor influencing match outcomes.
2. Data Preparation
Data preparation involved a detailed pipeline to clean, transform, and enhance match-level datasets. The data, sourced from football-data.co.uk, required handling column name inconsistencies, standardizing date formats, and removing null rows. The odds, provided by in these datasets required minimal preprocessing apart from standardizing column names across different seasons. All data preparation was performed using pandas.
A preprocessing function was designed to process each season's data, comprising 380 matches. Key tasks included:
- One-Hot Encoding: The FTR column, denoting home win, draw, or away win, was encoded to create target classes.
- Splitting Match Data: The dataset was divided into "home" and "away" subsets, with cumulative statistics for each team calculated. These datasets were merged to create a comprehensive team-level dataset.
- Feature Engineering: Running totals, averages, and recent form metrics (e.g., last three matches) were calculated for key statistics like goals, shots, corners, fouls, and yellow/red cards.
- Relative Features: To capture match dynamics, relative differences between home and away team statistics were computed (e.g., home goals minus away goals).
Transfer data from Transfermarkt contributed valuable financial metrics, including money spent, money received, and player arrivals. Meanwhile, historical team finishing positions were manually gathered from online sources. These finishing positions, from the two seasons prior to the current match season, were normalized to reflect team rankings, with promoted teams assigned a score of zero.
- Promoted Teams: Promoted teams were assigned a normalized score of zero for the previous seasons, while existing teams received scores based on their relative positions (e.g., 1st place = 20, 20th place = 1).
- Transfer Data: Financial metrics from Transfermarkt (e.g., spending, earnings) were converted from strings to numeric values using a custom parsing function. This data was added after the transfer windows (summer and winter) to reflect roster changes.
3. Exploratory Analysis
I began by analyzing the percentage distribution of match outcomes (home wins, draws, and away wins) across all seasons. Home wins were the most common result, comprising nearly 46% of all matches. Draws and away wins followed at 24.2% and 29.9%, respectively.
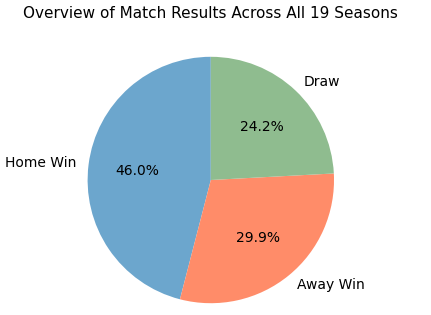
Figure 1: Pie chart showing the overall distribution of match outcomes (home wins, draws, and away wins) across all seasons.
To better understand how match outcomes varied over time, I plotted a stacked bar chart showing the distribution of home wins, draws, and away wins across all 19 seasons. An anomaly stood out in the 2020/21 season, which had more away wins than home wins. This irregularity coincided with the COVID-19 pandemic, where matches were largely played without crowds. This suggests that crowd support plays a pivotal role in the home advantage.
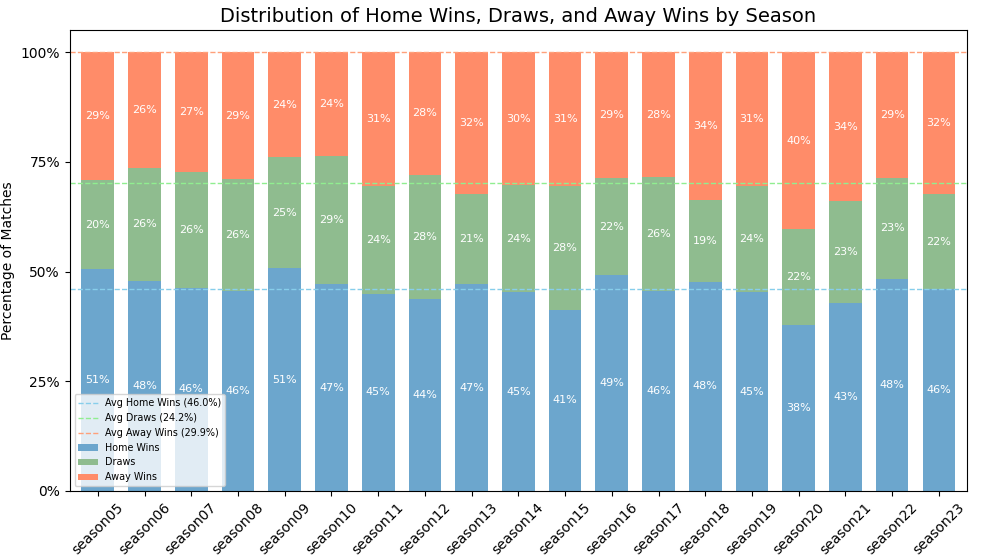
Figure 2: Stacked bar chart showing the distribution of match outcomes (home wins, draws, and away wins) across all 19 seasons, highlighting the anomaly in the 2020/21 season.
I evaluated the accuracy of the betting market's (specifically Bet365's) predictions. Overall, the market correctly predicted the match result 55.1% of the time, with accuracy ranging from 47.4% to 61.1% across different seasons.
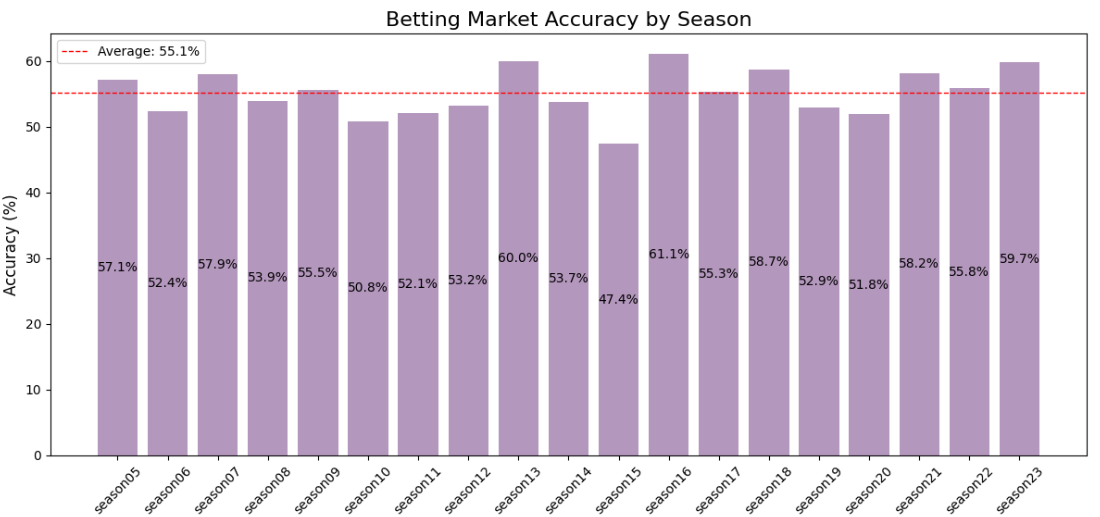
Figure 3: Bar chart showing the accuracy of Bet365’s predictions for match outcomes across different seasons.
Next, I explored whether betting market accuracy correlated with the percentage of home wins, draws, and away wins in a season. The results revealed:
- Home Wins: Correlation = 0.49, p-value = 0.034 (Statistically Significant)
- Draws: Correlation = -0.68, p-value = 0.001 (Statistically Significant)
- Away Wins: Correlation = 0.12, p-value = 0.623 (Not Statistically Significant)
Finally, I analyzed which non-betting based features had the strongest influence on match results (FTR). I did this by seeing what features had the strongest influence on home wins and I assigned scores of 3 for home wins, 2 for draws, and 1 for away wins, I identified the following highly correlated features:
- diff.PositionAward: Teams finishing higher in previous seasons were more likely to win (0.36).
- diff.total.shots: Higher average shots in all games so far in the current season (0.35).
- diff.total.win: Teams with more wins so far this season (0.31).
Conversely, these features showed the strongest negative correlations:
- diff.total.shots_against: Teams who are having more shots against them so far this season (0.31).
- diff.total.loss: Teams who have lost more so far this season (0.29).
- diff.total.corners_conceded: Teams who are conceding more corners (0.28).
Machine Learning
I explored various models using sklearn and PyTorch, and the best-performing models were sklearn's Random Forest and XGBoost classifier models. I performed cross-validation on the training dataset to tune the parameters for both models. The best versions of both models achieved an accuracy of over 60% when tested on the test set. XGBoost, in particular, proved to be slightly better, sometimes outperforming Random Forest by about 0.5%.
Ultimately, I achieved an accuracy of 61%. Most predictions were either a win for the home or away team, with draws being a rare outcome. The F1-score for home predictions was 0.71, while for away predictions, it was 0.61. However, the F1-score for draws was only 0.07, primarily due to a very low recall value for draw predictions.
See Figure 4 for a confusion matrix illustrating the performance of my predictions.
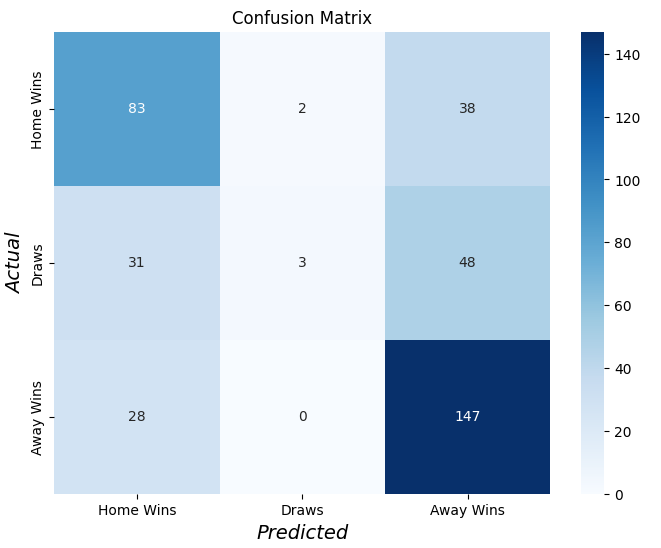
Figure 4: Confusion matrix showing the performance of the machine learning model predictions.
Visualization
Interactive dashboards were created in Tableau to display team rankings, match predictions, and key statistics. These dashboards enable users to explore the data and predictions in an intuitive way.
Key Insights
- Home teams win approximately 55% of the time, highlighting a strong home-field advantage.
- Teams in the top five positions consistently achieve higher predictive probabilities for wins, even when playing away.
- Seasonal trends, such as mid-season performance dips, were observed in several teams.
Challenges & Solutions
One of the main challenges I faced was narrowing down the feature set. To tackle this, I conducted correlation analysis, performed PCA, and reviewed feature importance scores from the models. While some features contributed minimally, they did not cause overfitting, and I chose to omit them to streamline the model. However, attempts to significantly reduce features often led to declines in model performance rather than improvements. Another challenge was the imbalanced data, especially the rarity of draws. I experimented with SMOTE to generate synthetic samples for draw outcomes, which enhanced the model's ability to predict draws but came at the expense of overall accuracy. Moving forward, I plan to improve the dataset by incorporating additional features and gathering more data, as discussed below.
Results
To evaluate the model's performance in the 2023/2024 Premier League season, a Monte Carlo simulation was conducted. This simulation aimed to assess the statistical significance of the actual profit generated by using the model's predictions to guide betting decisions.
The simulation involved placing a hypothetical $10 bet on each match of the season, with the betting choice (home win, draw, or away win) determined by a randomized selection weighted according to the betting market odds. For instance, if the odds implied a 20% chance of a home win, 20% chance of a draw, and 60% chance of an away win, the simulated bet would be placed on the away win with a 60% probability.
This process was repeated 10,000 times, generating a distribution of potential profits. The average profit across these simulations was -$194.66. This distribution was then compared to the actual profit of $201 achieved by following the model's predictions.
The analysis revealed that the actual profit, while not statistically significant at the 5% level (p-value = 0.0583), suggests that the model's predictions may not be merely due to chance. Although the p-value of 0.0583 is slightly above the conventional threshold for statistical significance, it indicates a trend towards the model's ability to identify profitable betting opportunities. To assess the potential for exceeding the expected profit, a 95% one-sided confidence interval was calculated. This analysis revealed an upper bound of $222.71, indicating that with 95% confidence, the profit resulting from the model's predictions is unlikely to surpass this value.
The distribution of profits from the Monte Carlo simulation (shown below) reveals a wide range of possible outcomes, highlighting the inherent volatility of sports betting.
Despite the negative average profit from the simulations, the statistically significant actual profit and the relatively high p-value encourage further investigation and model improvement. Future work will focus on incorporating additional data sources, such as player-level statistics and lower league data, to enhance predictive accuracy and potentially uncover more significant betting edges.
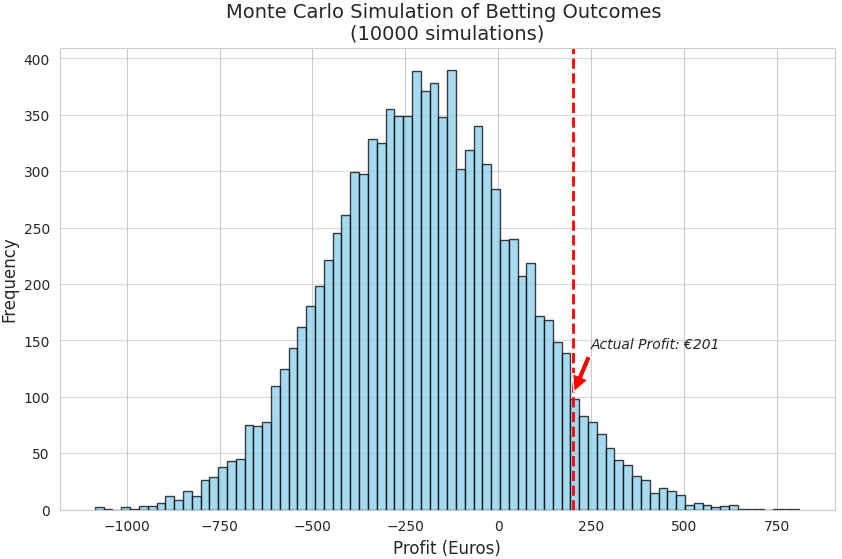
Figure 5: Monte Carlo simulation results showing profit distribution and statistical significance.
Future Improvements
- Implementing deep learning techniques, such as recurrent neural networks, to enhance time-series analysis.
- Integrating player-level data, which could significantly improve model performance but is challenging to obtain. I had access to this data in a previous project with a smaller dataset across various leagues, and it noticeably boosted model accuracy.
- Expanding visualizations to include detailed player-level analysis, providing deeper insights into individual contributions.
- Collecting more match data, especially focusing on teams that play mid-week in cup competitions. This could reveal whether the added strain of playing more cup matches leads to underperformance due to scheduling conflicts.
- Leveraging lower league data to assess whether predictions are more or less difficult in these leagues. I have access to this data, which will make it a manageable task to explore.
- Conducting web scraping to gather match previews, which could capture sentiment and provide valuable insights into suspended or injured star players. While some sentiment may already be reflected in betting markets, this additional source could still offer meaningful contributions.
- Investigating weather data, as this could be a relevant feature, though I haven't yet found reliable sources online for this information.
I am planning to pursue these improvements as I work towards building a cutting-edge match prediction system.
GitHub Repository
Explore the complete project, including code and data processing steps, on GitHub.
This project builds on insights gained from my earlier explorations into football analytics. Here are some key takeaways from those projects:
- premier_league_predictions_messy: This repository contains the rough work, dead ends, and initial experiments that ultimately led to the refined project presented in this blog post. It primarily serves as a record of my development process, showcasing the various approaches I tried before arriving at the final model. I later created a new GitHub repository (premier_league_predictions) to house the cleaned-up and optimized version.
- football_analysis: In this project, I explored a dataset with more granular data, including player-level statistics. However, the dataset had a smaller sample size in terms of the overall number of matches. This project provided valuable experience working with detailed player data, but highlighted the limitations of having less overall data to do analysis with.
These earlier experiences have not only informed the development of the more refined and comprehensive model presented in this blog post but have also shaped my vision for the future direction of my football analysis.
